Difference between revisions of "Spatial Manager™ for AutoCAD - FAQs: Thematic Maps ("Professional" edition only)"
m |
m |
||
| Line 50: | Line 50: | ||
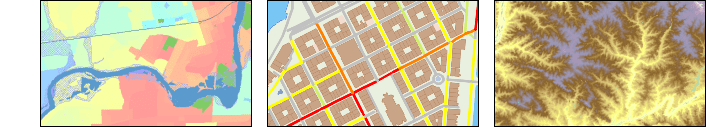
<span title="Samples of Categorized, Graduated and Graduate Gradient Thematic Maps">[[Image:SPMThemMapsTypes.png|link=]]</span> | <span title="Samples of Categorized, Graduated and Graduate Gradient Thematic Maps">[[Image:SPMThemMapsTypes.png|link=]]</span> | ||
| − | '' | + | *'''Field''' |
| + | **Table and Field whose values will be represented by the Thematic Map | ||
Revision as of 08:34, 15 August 2022
![]()
![]()
Notes:
- Some components in the images on this page (providers, names, windows look, etc.) may be slightly different from those that will appear on your computer
- Some application functions need to access the Internet from the application itself. If you experiment problems in any process, ask your network administrator if there is a Proxy server installed on your network. You can configure the Proxy settings through the application options
- Some geographic data providers (Geocode, image Maps, etc.) may need a user account, which you can configure in the Service Provider API Keys settings through the application options
Introduction
- Objective of this section
- To learn how to change the visual appearance of objects depending on the values of a data field of an associated table (Thematic Map)
- Topics in this section
- Definition of new Thematic Maps
- Choose the type of a new Thematic Map
- Auto-generation of Styles
- Styles creation, deletion and editing
- Thematic colors of objects and optional fills
- Management of Thematic Maps from the application Explorer
- Activation and deactivation of Thematic Maps
How can I graphically represent in the drawing the Data values attached to the objects?
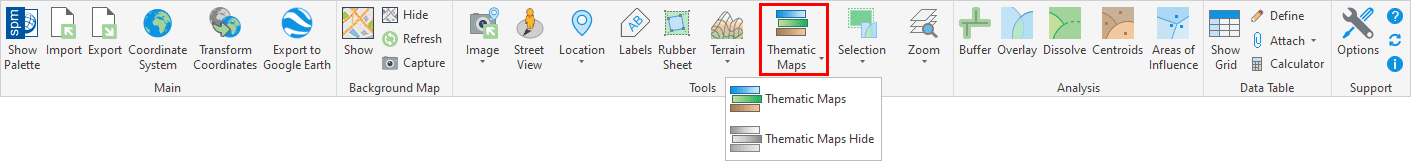
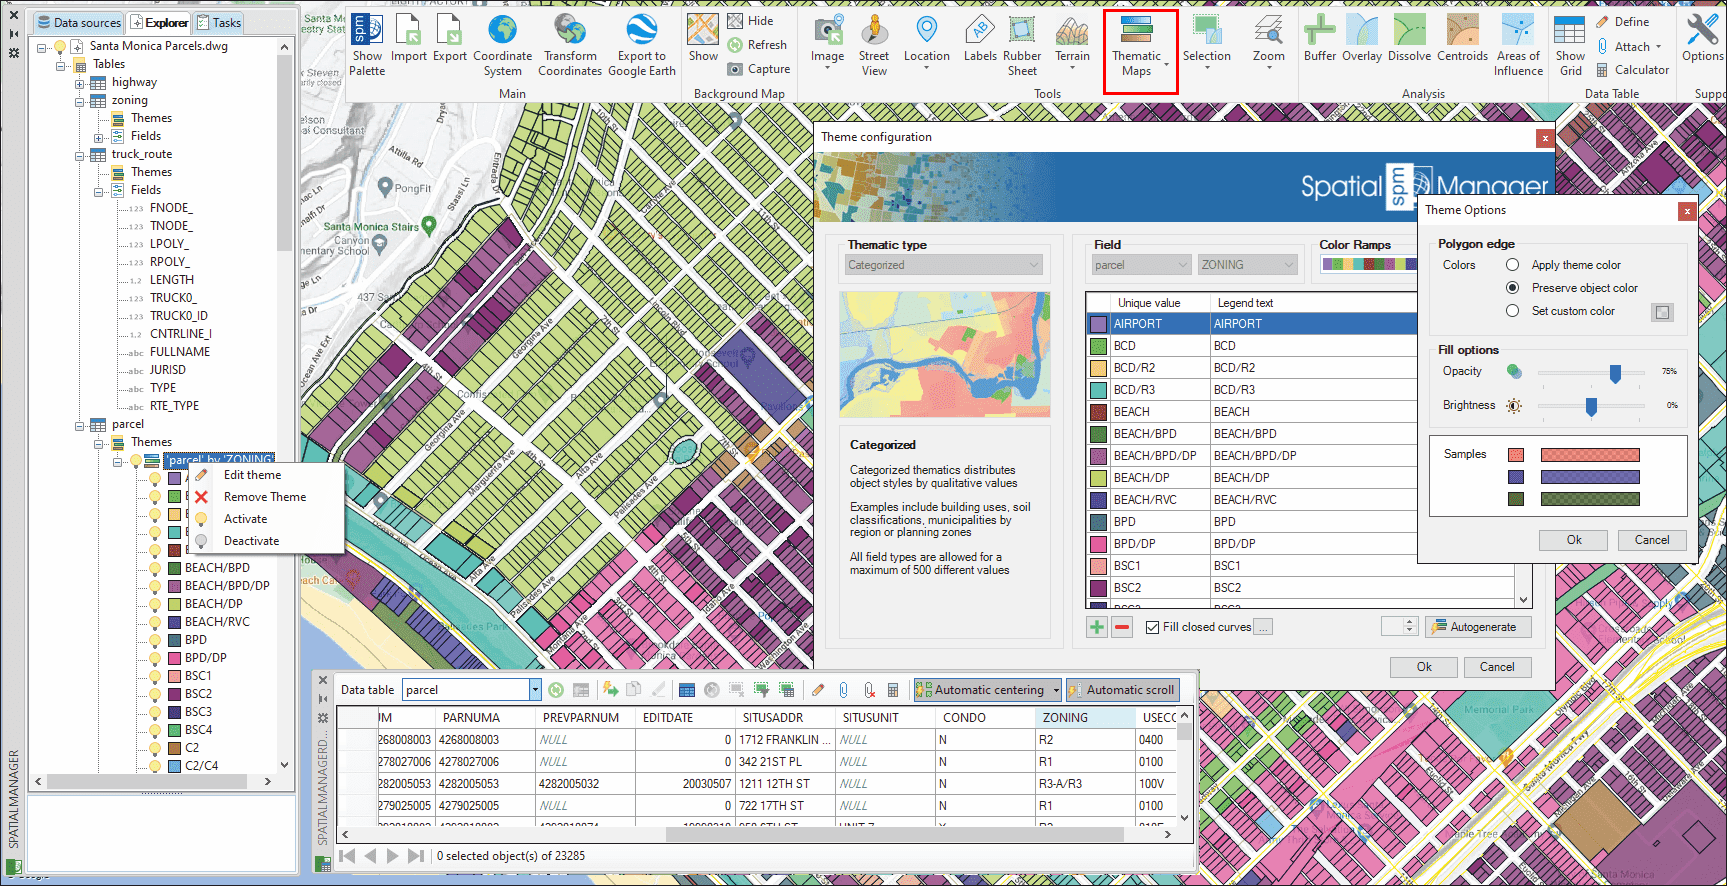
Spatial Manager™ for AutoCAD includes the Thematic Maps functionality, which allows to temporarily change the objects color in the drawing according to their associated alphanumeric data. You can define a new Thematic Map using the 'SPMTHEMATICMAP' command, whose window includes the definition of all the necessary parameters and options, as you can read below
In a drawing you can define as many Thematic Maps as you wish and activate or deactivate (return the display of objects to its normal state) the Maps or any of the Styles. In addition, you can edit the colors and names of the Styles, and the visual update of the objects is Dynamic, i.e. if data values are modified while a Thematic Map is active, the colors will automatically change to reflect the new values of the affected objects
Thematic Maps in a drawing
In the Thematic Map definition (and edition) window all the parameters and options of the Map are specified:
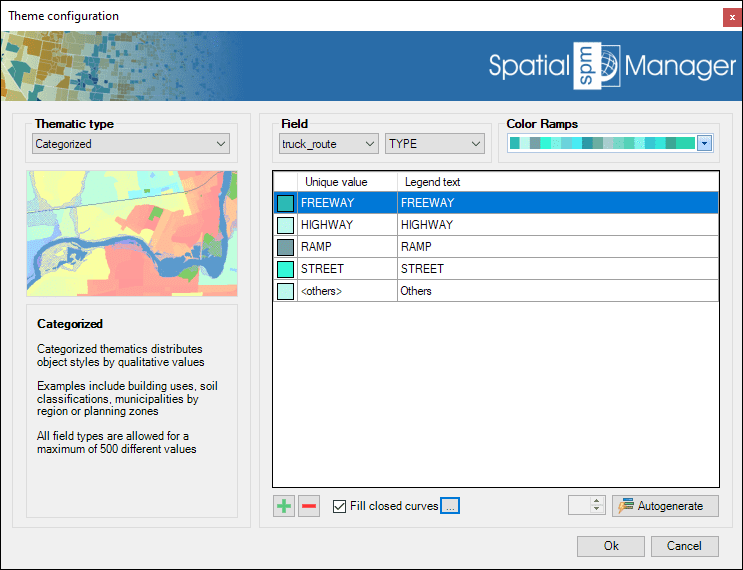
- Thematic type
- Categorized: Distributes object Styles by Qualitative values. Examples include building uses, soil classifications, municipalities by region, or planning zones. All field types are allowed for a maximum of 500 different values
- Graduated: Distributes object Styles considering value Ranges. Examples include rivers by flow, buildings by height, or urban areas by population density. Numeric fields (including date/time) are allowed
- Graduated Gradient: Distributes object Styles considering value/color Ranges, creating one or more Gradients. Examples include altimetry representations, or heat maps. Numeric fields (including date/time) are allowed
- Field
- Table and Field whose values will be represented by the Thematic Map
Related links
- Blog posts
![]()
![]()