Difference between revisions of "Spatial Manager™ for AutoCAD - FAQs: GIS Analysis ("Professional" edition only)"
m |
m |
||
| (97 intermediate revisions by the same user not shown) | |||
| Line 6: | Line 6: | ||
*''Some components in the images on this page (providers, names, windows look, etc.) may be slightly different from those that will appear on your computer'' | *''Some components in the images on this page (providers, names, windows look, etc.) may be slightly different from those that will appear on your computer'' | ||
*''Some application functions need to access the Internet from the application itself. If you experiment problems in any process, ask your network administrator if there is a Proxy server installed on your network. You can configure the [[Spatial_Manager%E2%84%A2_for_AutoCAD_-_FAQs:_Interface#Options|Proxy settings through the application options]]'' | *''Some application functions need to access the Internet from the application itself. If you experiment problems in any process, ask your network administrator if there is a Proxy server installed on your network. You can configure the [[Spatial_Manager%E2%84%A2_for_AutoCAD_-_FAQs:_Interface#Options|Proxy settings through the application options]]'' | ||
| − | *'' | + | *''Some geographic data providers (Geocode, image Maps, etc.) may need a user account, which you can configure in the [[Spatial_Manager%E2%84%A2_for_AutoCAD_-_FAQs:_Interface#Options|Service Provider API Keys settings through the application options]]'' |
| Line 12: | Line 12: | ||
===Introduction=== | ===Introduction=== | ||
*'''Objective of this section''' | *'''Objective of this section''' | ||
| − | ** | + | **To learn how to use advanced GIS analysis tools in your drawings and maps |
*'''Topics in this section''' | *'''Topics in this section''' | ||
| − | ** | + | **Create Buffers from point, linear or polygonal borders objects |
| + | **Process spatial Overlays which will create new drawing objects based on the operation results | ||
| + | **Dissolve polyonal objects in order to create surrounds of adjacent objects | ||
| + | **Create Centroids from selected polygons or add Centroids data to the polygons that contain them | ||
| + | **Calculate and draw Areas of Influence from selected point objects | ||
| − | + | ==GIS Analysis tools== | |
| + | Spatial Manager™ for AutoCAD includes a set of advanced tools designed for geometric and spatial analysis of geographic objects and their geometric relationships, resulting in new objects generated from the resolution of such analysis | ||
| + | <span title="GIS Analysis commands in the Spatial Manager™ for AutoCAD ribbon">[[Image:SPMAnalysisRibbon.png|GIS Analysis commands in the Spatial Manager™ for AutoCAD ribbon|border|link=]]</span> | ||
| − | |||
| − | |||
| + | [[image:SPMGISToolsACAD.png|border|900px|Performing GIS Analysis in the drawing|link={{filepath:SPMGISToolsACAD.png}}]] | ||
| − | |||
| + | ''Performing GIS Analysis in the drawing'' | ||
| − | |||
| − | '' | + | '''About objects selection''' |
| + | Some of the analysis tools described below allow object selections before or during their execution. Even some of them (such as SPMOVERLAY or SPMCENTROID) allow you to select two groups of objects to operate between them. For all of these commands, the following notes and instructions apply: | ||
| + | *''Select all objects'': All objects in the drawing will be processed | ||
| + | *''Only selected objects'': Only a selection of objects will be processed. You can select the objects before executing the commands or by using the Selecting buttons in their corredponding windows | ||
| + | **Manual selection | ||
| + | **Select by Query: Select objects according to the result of a simplex or compound data query [[Spatial_Manager%E2%84%A2_for_AutoCAD_-_FAQs:_Advanced_Selection_(%22Standard%22_and_%22Professional%22_editions_only)#Can_I_define_a_selection_of_objects_based_on_the_values_of_their_data.3F|''(See "Selecting by Query")'']] | ||
| + | **Select by Table: Select objects which have been previously attached to a specific data table [[Spatial_Manager%E2%84%A2_for_AutoCAD_-_FAQs:_Advanced_Selection_(%22Standard%22_and_%22Professional%22_editions_only)#Can_I_select_all_the_objects_attached_to_the_same_data_table.3F|''(See "Selecting by Table")'']] | ||
| + | ***''Note: As you can select the objects previously to execute the commands, in addition to the use of the above included selection options or in combination with them, you can make use of some other [[Spatial_Manager%E2%84%A2_for_AutoCAD_-_FAQs:_Advanced_Selection_(%22Standard%22_and_%22Professional%22_editions_only)|Advanced selection application tools]], select objects in the [[Spatial_Manager%E2%84%A2_for_AutoCAD_-_FAQs:_Data_Structure_Management_(%22Standard%22_and_%22Professional%22_editions_only)#Can_I_view_and_edit_the_objects_data_in_a_table_form.3F_.28.22Professional.22_edition_only.29|Data Grid]] or any other selection method available in AutoCAD (Quick Select, etc.). Also note that, as most of the advanced application or AutoCAD selection commands will let you apply the selection to the current selection, the number of possible combinations to select what you are interested in is almost unlimited | ||
| + | *''Select objects in a layer'': Only the objects included in an AutoCAD Layer will be processed. You can select the layer using the drop-down list in this window | ||
| + | ''Note: The selection of objects in AutoCAD may be a few slower when the "SpatialManager" palette is open, depending on the data of the objects'' | ||
| − | |||
| − | |||
| − | |||
| − | |||
| − | |||
| − | |||
| − | |||
| − | |||
| + | ===Buffer=== | ||
| + | The command 'SPMBUFFER' in Spatial Manager™ for AutoCAD allows you to generate Buffered polygons around point objects, linear objects or polygon boundaries. Buffer distance can be constant or taken from the value of a table field for each object, it is possible to merge the generated objects in their common areas and different styles of joins and endings can be chosen | ||
| − | |||
| − | + | <span title="Buffer parameters window">[[image:SPMBufferOptionsACAD.png|link=]]</span> | |
| − | + | *''Objects selection: See the paragraph [[#GIS_Analysis_tools|''"About objects selection"'']] above | |
| − | * | + | *''Buffer options:'' You can select the Buffer distance (fixed value or field-based value), the distance units (read below), the Join and End cap styles and if you want to Dissolve/Merge the generated Buffered polygons |
| − | * | + | **About Units conversion: If a coordinate system with a defined unit of measurement is assigned to the drawing, the user can select another unit from the drop-down list to define the Buffer distance entered and the application will perform the conversion between it and the one defined by the coordinate system. If the drawing does not have a coordinate system assigned to it, or the coordinate system does not have defined units, the user can select from the drop-down lists the unit in which the entered Buffer distance is defined and the drawing units; the application will perform the conversion between the two |
| − | * | + | *''Table/Layer name:'' This setting defines the target Layer and data table name for the Buffers. You can select an existing Layer in the drawing or you can write the name to create a new Layer. Buffer objects will adopt the same data as the objects that generate them, unless the "Dissolve/Merge" option has been checked, in which case this would not make sense and the combined Buffer objects are not attached to any data table |
| + | **''Apply random colors to new Layers'' | ||
| + | *''Create'': Dissolved objects type, Borders or Polygons. The Polygons option allow you to select MPolygons as the type of object to use. This options is available on all compatible Autodesk products (even on vanilla, plain or basic AutoCAD) (AutoCAD 2013 and upper). The MPolygons can be defined by multiple rings, even including holes, as a single AutoCAD object | ||
| + | **''Fill areas using Hatches'' | ||
| + | *''Treat closed polylines as polygons:'' When checked (default value), all closed Polylines in the drawing will be considered as Polygons and not as linear objects. Most of the time the closed polylines represent polygonal elements | ||
| − | |||
| + | ===Overlay=== | ||
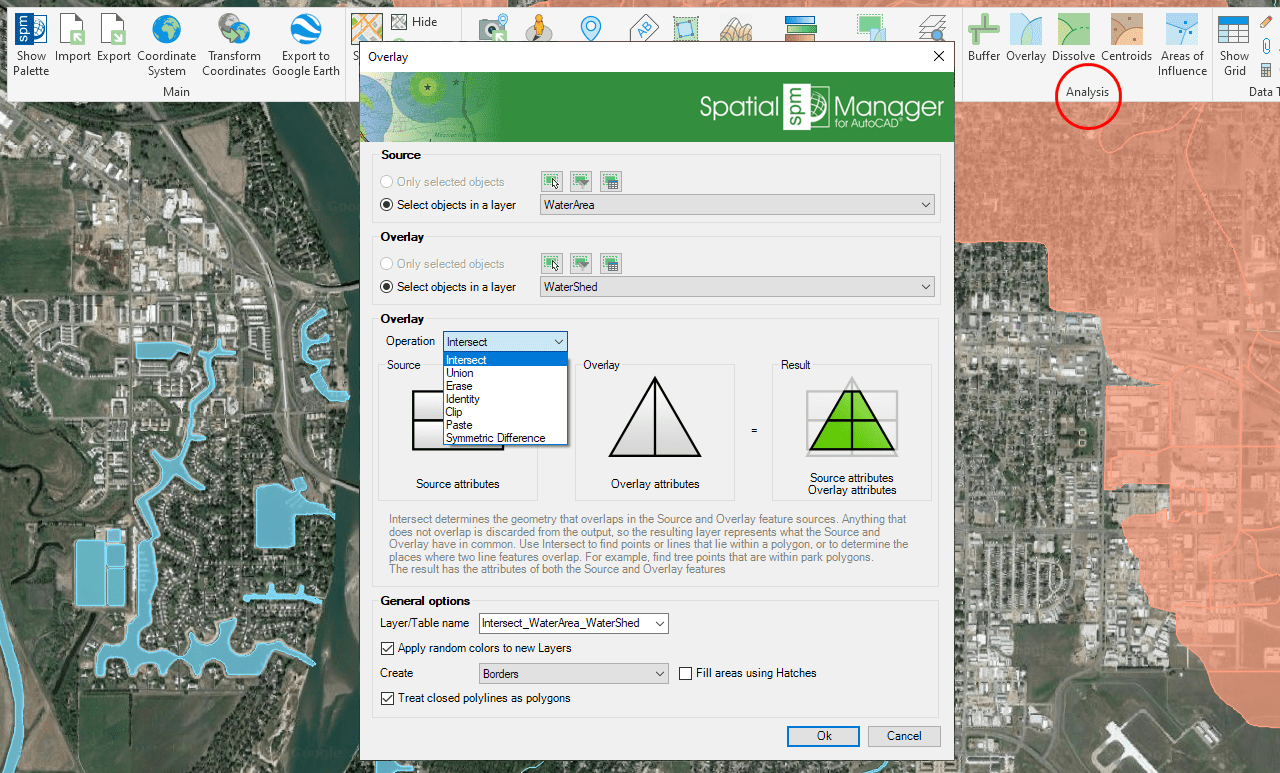
| + | The command 'SPMOVERLAY' in 'Spatial Manager™ for AutoCAD' allows you to create new objects based on geometric and data operations between two existing object groups | ||
| − | = | + | <span title="Overlay parameters window">[[image:SPMOverlayACAD.png|link=]]</span> |
| − | |||
| − | + | This function allows you to generate new objects in the drawing by performing "geometric operations" between two groups of existing objects: "Source" (Group 1) and "Overlay" (Group 2). For example, according to the chosen parameters in this image, for all selected Source objects (Roads, etc.) that are located within any Parcel, the Overlay Identity function will create new objects which will are equal to the Source objects "broken" in the Parcel limits | |
| − | + | *''Objects selection: See the paragraph [[#GIS_Analysis_tools|''"About objects selection"'']] above (Group 1 and Group 2) | |
| + | *Overlay parameters and options | ||
| + | **Operation | ||
| + | ***''Intersect'': Determines the geometries that overlap in the Source and Overlay object groups. Anything that does not overlap is discarded from the output, so the resulting objects represent what the Source and Overlay have in common. Use Intersect in order to find points or lines that lie within a polygon, or to determine the places where two linear objects overlap. For example, find tree point objects that are within park polygons. The resulting data table will include the data of both the Source and Overlay objects | ||
| + | ***''Union'': Determines the geometries that exist in either the Source and Overlay objects. Where the geometries intersect, additional objects are created. The resulting objects are the sum of the two comparison object groups. Use Union in order to combine two group of related polygon objects. For example, create new objects that combine the business district and the theater district when the objects overlap. The resulting data table will include the data of both the Source and Overlay objects | ||
| + | ***''Erase'': Determines the geometries from the Source objects that do not intersect with the Overlay objects. Use Erase in order to subtract sections for a group of objects. For example, find all roads that lie outside the enterprise district, or all hospitals that are outside a flod zone. The resulting data table will include the data of Source objects only | ||
| + | ***''Identity'': Creates new objects where the Source and Overlay objects intersect. Use Identity in order to split objects at the point where they intersect with another objects group, and to create new objects at that point. For example, divide roads or parcels where they cross city borders. The resulting data table will include the data of both the Source and Overlay objects | ||
| + | ***''Clip'': Like Intersect, Clip creates objects from the areas of the Source that overlap with the Overlay. Use Clip in order to find objects that lie within a geometric area. For example, find hydrants within a development, or road segments within a particular neighborhood. The resulting data table will include the data of Source objects only | ||
| + | ***''Paste'': Creates new objects by pasting the Overlay objects onto the Source objects. All Overlay objects become new objects in the operation result. In addition, the areas of the Source that do not fall within the Overlay objects become also new objects in the operation result. Use Paste in order to combine two overlaping groups of objects. For example, add the data of city districts to the developments that overlap. The resulting data table will include the data of both the Source and Overlay objects | ||
| + | ***''Symmetric Difference'': Determines the areas in the Source and Overlay that do not overlap. Overlapping areas of the objects are discarded in the output. The non-overlapping areas become new objects. Use Symmetric Difference in order to find areas that are mutually exclusive in two group of objects. For example, find new housing developments that are outside school districts. The resulting data table will include the data of both the Source and Overlay objects | ||
| + | **General options | ||
| + | ***''Table/Layer name:'' This setting defines the target Layer and data table name for the new created objects. You can select an existing Layer in the drawing or you can write the name to create a new Layer. The data of the new objects will be those of the objects selected in Group 1. Whenever possible (depending on the type of Overlay operation), data from Group 2 will be merged in the same table. For example, if Buildings and Parcels are Overlapped by Intersection, the new objects will be geometrically equal to the buildings that are located entirely or partially within any parcel, and the data table will include the data of the buildings and parcels in a combined table | ||
| + | ****''Apply random colors to new Layers'' | ||
| + | ***''Create'': New Overlay objects type, Borders or Polygons. The Polygons option allow you to select MPolygons as the type of object to use. This options is available on all compatible Autodesk products (even on vanilla, plain or basic AutoCAD) (AutoCAD 2013 and upper). The MPolygons can be defined by multiple rings, even including holes, as a single AutoCAD object | ||
| + | ****''Fill areas using Hatches'' | ||
| + | ***''Treat closed polylines as polygons:'' When checked (default value), all closed Polylines in the drawing will be considered as Polygons and not as linear objects. Most of the time the closed polylines represent polygonal elements | ||
| − | |||
| − | '' | + | ===Dissolve=== |
| + | The command 'SPMDISSOLVE' in Spatial Manager™ for AutoCAD allows you to generate new Polygons based on the grouping of other adjacent polygons with some common data | ||
| + | <span title="Dissolve parameters window">[[image:SPMDissolveACAD.png|link=]]</span> | ||
| − | |||
| − | |||
| + | *''Dissolve options:'' You can select the common Table/Field data for dissolving the polygons (even including null data). To reduce possible precision errors in the geometry, you can check the option to generate a temporary small buffer around the polygon boundaries in order to avoid as much as possible the generation of inner holes during the operation. Check the option "Create labels" if you want to Label the common data for every new polygon | ||
| + | **''Label options''. You can define the Style, Height and Justification of the Label Text objects here. You can configure if you want to insert the new Polygons geometry and its Labels or the Labels only. Be careful: if you check this box you will only get the Labels (Text objects) but not the dissolved polygons. As added parameters, you can set the option to use or not LUPREC for decimal places ''(see Notes below)'' and ''Mask labels'' which will generate masks (Wipeout objects, grouped with the Labels) and they will "trim" the objects located behind the Labels in order to improve its reading | ||
| + | ***''Notes:'' | ||
| + | ****''You can choose that the value of the LUPREC variable (Length precision) be used or not for the number of decimal places when labeling objects using a numerical field (Please, take a look to LUPREC and UNITS in the AutoCAD Help)'' | ||
| + | ****''Label Masks may have some functional issues or may not be available in versions earlier than AutoCAD 2017'' | ||
| + | *''Table/Layer name:'' This setting defines the target Layer and data table name for the new dissolved Polygons. You can select an existing Layer in the drawing or you can write the name to create a new Layer. Dissolved polygons will include the common dissolve data (1 field) as the polygons to dissolve | ||
| + | **As you can see in the next setting, the Layer name can be variable for each new polygon but the Table name for the attached data will be unique for all the created polygons | ||
| + | **''Use Field values for Layer:'' Here you can select that the Field used to merge define its value as the name of the Layer for the new polygons. If this value is null for any polygon, or the setting is left blank, the polygon will be drawn in the Layer selected in the previous setting | ||
| + | ***Note that this setting is only for the name of the target Layer but not for the Table name | ||
| + | **''Apply random colors to new Layers'' | ||
| + | *''Create'': Dissolved objects type, Borders or Polygons. The Polygons option allow you to select MPolygons as the type of object to use. This options is available on all compatible Autodesk products (even on vanilla, plain or basic AutoCAD) (AutoCAD 2013 and upper). The MPolygons can be defined by multiple rings, even including holes, as a single AutoCAD object | ||
| + | **''Fill areas using Hatches'' | ||
| + | *''Treat closed polylines as polygons:'' When checked (default value), all closed Polylines in the drawing will be considered as Polygons and not as linear objects. Most of the time the closed polylines represent polygonal elements | ||
| − | + | ''Note: Since this operation can only be performed on polygonal objects, the application will alert the user either if there are non-polygonal objects attached to the selected table (warning) or if there are not enough polygons to process it (cancellation)'' | |
| − | |||
| − | |||
| − | |||
| + | ===Centroids=== | ||
| + | The command 'SPMCENTROID' in Spatial Manager™ for AutoCAD includes two functionalities. The first one allows you to generate Centroids (Point objects) for the selected polygons (The polygons data, if any, will be attached also to the Centroid objects). The second one allows you to capture the selected Centroids data in order to add it to a copy of the selected Polygons that contain them | ||
| − | + | '''Create centroids''' | |
| − | |||
| − | <span title=" | + | <span title="Centroid parameters window">[[image:SPMCentroidsACAD.png|link=]]</span> |
| − | + | *''Objects selection: See the paragraph [[#GIS_Analysis_tools|''"About objects selection"'']] above | |
| + | *''Table/Layer name:'' This setting defines the target Layer and data table name for the Centroids. You can select an existing Layer in the drawing or you can write the name to create a new Layer. Centroids objects will adopt the same data as the corresponding polygons | ||
| + | **''Apply random colors to new Layers'' | ||
| + | *''Treat closed polylines as polygons:'' When checked (default value), all closed Polylines in the drawing will be considered as Polygons and not as linear objects. Most of the time the closed polylines represent polygonal elements | ||
| − | + | '''Copy data from centroids to polygons (capture centroids)''' | |
| − | |||
| + | <span title="Centroid parameters window">[[image:SPMCentroidsACAD2.png|link=]]</span> | ||
| − | + | *''Centroids selection: Any point object. See the paragraph [[#GIS_Analysis_tools|''"About objects selection"'']] above | |
| − | + | *''Polygons selection: Any polygonal object. See the paragraph [[#GIS_Analysis_tools|''"About objects selection"'']] above | |
| + | *''Capture centroids options'' | ||
| + | **''Create also polygons without centroid found'': As a copy of the selected polygons that contain any Centroid will be created, you can also choose to duplicate even polygons without Centroid found | ||
| + | *''Table/Layer name:'' This setting defines the target Layer and data table name for the created polygons. You can select an existing Layer in the drawing or you can write the name to create a new Layer | ||
| + | **''Apply random colors to new Layers'' | ||
| + | *''Create'': Duplicate polygons object type, Borders or Polygons. The Polygons option allow you to select MPolygons as the type of object to use. This options is available on all compatible Autodesk products (even on vanilla, plain or basic AutoCAD) (AutoCAD 2013 and upper). The MPolygons can be defined by multiple rings, even including holes, as a single AutoCAD object | ||
| + | **''Fill areas using Hatches'' | ||
| + | *''Treat closed polylines as polygons:'' When checked (default value), all closed Polylines in the drawing will be considered as Polygons and not as linear objects. Most of the time the closed polylines represent polygonal elements | ||
| − | |||
| + | ===Areas of Influence=== | ||
| + | The command 'SPMINFLUENCEAREAS' in Spatial Manager™ for AutoCAD allows you to generate Polygons defined by the set of points closest to each point of a selection of Points in the drawing ([https://en.wikipedia.org/wiki/Voronoi_diagram ''Voronoi diagram'']). Each Polygon generated will adopt the same data (if any) as the corresponding Point. For example, would serve to determine which nearby areas are covered by each pharmacy in a municipality, and similar scenarios | ||
| − | |||
| + | <span title="Areas of Influence parameters window">[[image:SPMVoronoiAreasACAD.png|link=]]</span> | ||
| − | |||
| − | + | *''Objects selection: See the paragraph [[#GIS_Analysis_tools|''"About objects selection"'']] above | |
| − | + | *''Table/Layer name:'' This setting defines the target Layer and data table name for the new Polygons. You can select an existing Layer in the drawing or you can write the name to create a new Layer. Areas of Influence objects will adopt the same data as the corresponding Points | |
| − | |||
| − | |||
| − | |||
| − | |||
| − | |||
| − | |||
| − | |||
| − | |||
| − | * | ||
| − | |||
| − | |||
| − | |||
| − | |||
| − | |||
| − | |||
| − | |||
| − | |||
| − | |||
| − | |||
| − | |||
| − | |||
| − | |||
| − | |||
| − | |||
| − | |||
| − | |||
| − | |||
| − | |||
| − | |||
| − | |||
| − | |||
| − | |||
| − | |||
| − | |||
| − | |||
| − | |||
| − | |||
| − | |||
| − | |||
| − | |||
| − | |||
| − | |||
| − | |||
| − | |||
| − | |||
| − | |||
| − | |||
| − | |||
| − | |||
| − | |||
| − | |||
| − | |||
| − | |||
| − | |||
| − | |||
| − | |||
| − | |||
| − | |||
| − | |||
| − | |||
| − | |||
| − | |||
| − | |||
| − | '' | ||
| − | |||
| − | |||
| − | |||
| − | |||
| − | |||
| − | |||
| − | |||
| − | |||
| − | |||
| − | |||
| − | |||
| − | |||
| − | |||
| − | |||
| − | |||
| − | |||
**''Apply random colors to new Layers'' | **''Apply random colors to new Layers'' | ||
| − | + | *''Create'': Areas of Influence objects type, Borders or Polygons. The Polygons option allow you to select MPolygons as the type of object to use. This options is available on all compatible Autodesk products (even on vanilla, plain or basic AutoCAD) (AutoCAD 2013 and upper). The MPolygons can be defined by multiple rings, even including holes, as a single AutoCAD object | |
| − | + | **''Fill areas using Hatches'' | |
| − | |||
| − | |||
| − | |||
| − | |||
| − | |||
| − | |||
| − | |||
| − | |||
| − | |||
| − | |||
| − | |||
| − | |||
| − | |||
| − | |||
| − | |||
| − | |||
| − | |||
| − | |||
==Related links== | ==Related links== | ||
| − | + | *Blog posts | |
| + | **[https://www.spatialmanager.com/centroids-and-polygons/ Centroids and Polygons] | ||
| + | **[https://www.spatialmanager.com/dissolve-polygons/ Dissolve Polygons] | ||
| + | **[https://www.spatialmanager.com/buffers/ Buffers] | ||
| + | **[https://www.spatialmanager.com/tag/overlays/ Overlays] | ||
Latest revision as of 13:15, 24 August 2022
![]()
![]()
Notes:
- Some components in the images on this page (providers, names, windows look, etc.) may be slightly different from those that will appear on your computer
- Some application functions need to access the Internet from the application itself. If you experiment problems in any process, ask your network administrator if there is a Proxy server installed on your network. You can configure the Proxy settings through the application options
- Some geographic data providers (Geocode, image Maps, etc.) may need a user account, which you can configure in the Service Provider API Keys settings through the application options
Introduction
- Objective of this section
- To learn how to use advanced GIS analysis tools in your drawings and maps
- Topics in this section
- Create Buffers from point, linear or polygonal borders objects
- Process spatial Overlays which will create new drawing objects based on the operation results
- Dissolve polyonal objects in order to create surrounds of adjacent objects
- Create Centroids from selected polygons or add Centroids data to the polygons that contain them
- Calculate and draw Areas of Influence from selected point objects
GIS Analysis tools
Spatial Manager™ for AutoCAD includes a set of advanced tools designed for geometric and spatial analysis of geographic objects and their geometric relationships, resulting in new objects generated from the resolution of such analysis

Performing GIS Analysis in the drawing
About objects selection
Some of the analysis tools described below allow object selections before or during their execution. Even some of them (such as SPMOVERLAY or SPMCENTROID) allow you to select two groups of objects to operate between them. For all of these commands, the following notes and instructions apply:
- Select all objects: All objects in the drawing will be processed
- Only selected objects: Only a selection of objects will be processed. You can select the objects before executing the commands or by using the Selecting buttons in their corredponding windows
- Manual selection
- Select by Query: Select objects according to the result of a simplex or compound data query (See "Selecting by Query")
- Select by Table: Select objects which have been previously attached to a specific data table (See "Selecting by Table")
- Note: As you can select the objects previously to execute the commands, in addition to the use of the above included selection options or in combination with them, you can make use of some other Advanced selection application tools, select objects in the Data Grid or any other selection method available in AutoCAD (Quick Select, etc.). Also note that, as most of the advanced application or AutoCAD selection commands will let you apply the selection to the current selection, the number of possible combinations to select what you are interested in is almost unlimited
- Select objects in a layer: Only the objects included in an AutoCAD Layer will be processed. You can select the layer using the drop-down list in this window
Note: The selection of objects in AutoCAD may be a few slower when the "SpatialManager" palette is open, depending on the data of the objects
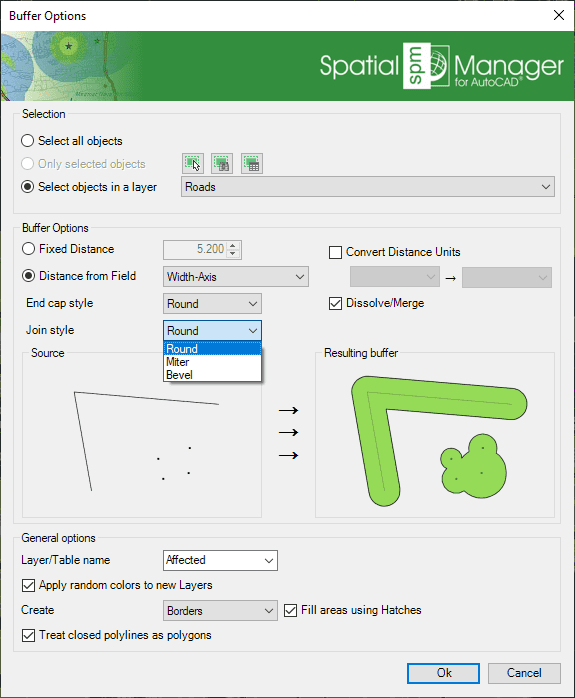
Buffer
The command 'SPMBUFFER' in Spatial Manager™ for AutoCAD allows you to generate Buffered polygons around point objects, linear objects or polygon boundaries. Buffer distance can be constant or taken from the value of a table field for each object, it is possible to merge the generated objects in their common areas and different styles of joins and endings can be chosen
- Objects selection: See the paragraph "About objects selection" above
- Buffer options: You can select the Buffer distance (fixed value or field-based value), the distance units (read below), the Join and End cap styles and if you want to Dissolve/Merge the generated Buffered polygons
- About Units conversion: If a coordinate system with a defined unit of measurement is assigned to the drawing, the user can select another unit from the drop-down list to define the Buffer distance entered and the application will perform the conversion between it and the one defined by the coordinate system. If the drawing does not have a coordinate system assigned to it, or the coordinate system does not have defined units, the user can select from the drop-down lists the unit in which the entered Buffer distance is defined and the drawing units; the application will perform the conversion between the two
- Table/Layer name: This setting defines the target Layer and data table name for the Buffers. You can select an existing Layer in the drawing or you can write the name to create a new Layer. Buffer objects will adopt the same data as the objects that generate them, unless the "Dissolve/Merge" option has been checked, in which case this would not make sense and the combined Buffer objects are not attached to any data table
- Apply random colors to new Layers
- Create: Dissolved objects type, Borders or Polygons. The Polygons option allow you to select MPolygons as the type of object to use. This options is available on all compatible Autodesk products (even on vanilla, plain or basic AutoCAD) (AutoCAD 2013 and upper). The MPolygons can be defined by multiple rings, even including holes, as a single AutoCAD object
- Fill areas using Hatches
- Treat closed polylines as polygons: When checked (default value), all closed Polylines in the drawing will be considered as Polygons and not as linear objects. Most of the time the closed polylines represent polygonal elements
Overlay
The command 'SPMOVERLAY' in 'Spatial Manager™ for AutoCAD' allows you to create new objects based on geometric and data operations between two existing object groups
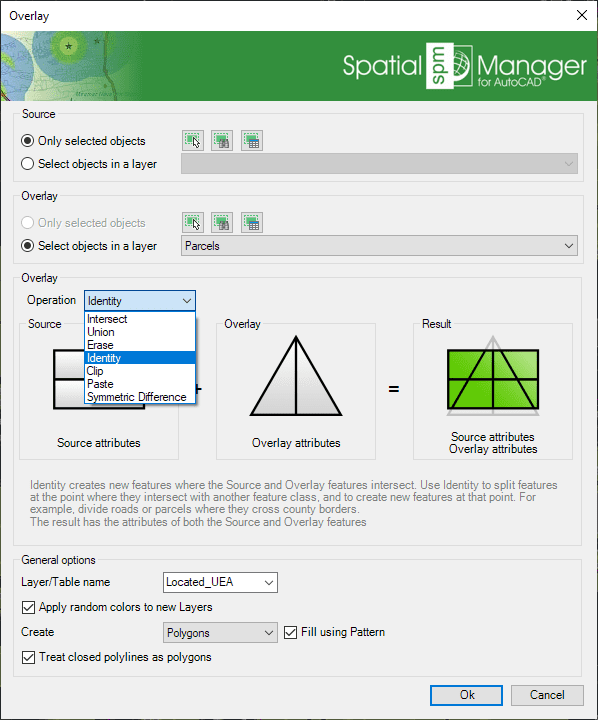
This function allows you to generate new objects in the drawing by performing "geometric operations" between two groups of existing objects: "Source" (Group 1) and "Overlay" (Group 2). For example, according to the chosen parameters in this image, for all selected Source objects (Roads, etc.) that are located within any Parcel, the Overlay Identity function will create new objects which will are equal to the Source objects "broken" in the Parcel limits
- Objects selection: See the paragraph "About objects selection" above (Group 1 and Group 2)
- Overlay parameters and options
- Operation
- Intersect: Determines the geometries that overlap in the Source and Overlay object groups. Anything that does not overlap is discarded from the output, so the resulting objects represent what the Source and Overlay have in common. Use Intersect in order to find points or lines that lie within a polygon, or to determine the places where two linear objects overlap. For example, find tree point objects that are within park polygons. The resulting data table will include the data of both the Source and Overlay objects
- Union: Determines the geometries that exist in either the Source and Overlay objects. Where the geometries intersect, additional objects are created. The resulting objects are the sum of the two comparison object groups. Use Union in order to combine two group of related polygon objects. For example, create new objects that combine the business district and the theater district when the objects overlap. The resulting data table will include the data of both the Source and Overlay objects
- Erase: Determines the geometries from the Source objects that do not intersect with the Overlay objects. Use Erase in order to subtract sections for a group of objects. For example, find all roads that lie outside the enterprise district, or all hospitals that are outside a flod zone. The resulting data table will include the data of Source objects only
- Identity: Creates new objects where the Source and Overlay objects intersect. Use Identity in order to split objects at the point where they intersect with another objects group, and to create new objects at that point. For example, divide roads or parcels where they cross city borders. The resulting data table will include the data of both the Source and Overlay objects
- Clip: Like Intersect, Clip creates objects from the areas of the Source that overlap with the Overlay. Use Clip in order to find objects that lie within a geometric area. For example, find hydrants within a development, or road segments within a particular neighborhood. The resulting data table will include the data of Source objects only
- Paste: Creates new objects by pasting the Overlay objects onto the Source objects. All Overlay objects become new objects in the operation result. In addition, the areas of the Source that do not fall within the Overlay objects become also new objects in the operation result. Use Paste in order to combine two overlaping groups of objects. For example, add the data of city districts to the developments that overlap. The resulting data table will include the data of both the Source and Overlay objects
- Symmetric Difference: Determines the areas in the Source and Overlay that do not overlap. Overlapping areas of the objects are discarded in the output. The non-overlapping areas become new objects. Use Symmetric Difference in order to find areas that are mutually exclusive in two group of objects. For example, find new housing developments that are outside school districts. The resulting data table will include the data of both the Source and Overlay objects
- General options
- Table/Layer name: This setting defines the target Layer and data table name for the new created objects. You can select an existing Layer in the drawing or you can write the name to create a new Layer. The data of the new objects will be those of the objects selected in Group 1. Whenever possible (depending on the type of Overlay operation), data from Group 2 will be merged in the same table. For example, if Buildings and Parcels are Overlapped by Intersection, the new objects will be geometrically equal to the buildings that are located entirely or partially within any parcel, and the data table will include the data of the buildings and parcels in a combined table
- Apply random colors to new Layers
- Create: New Overlay objects type, Borders or Polygons. The Polygons option allow you to select MPolygons as the type of object to use. This options is available on all compatible Autodesk products (even on vanilla, plain or basic AutoCAD) (AutoCAD 2013 and upper). The MPolygons can be defined by multiple rings, even including holes, as a single AutoCAD object
- Fill areas using Hatches
- Treat closed polylines as polygons: When checked (default value), all closed Polylines in the drawing will be considered as Polygons and not as linear objects. Most of the time the closed polylines represent polygonal elements
- Table/Layer name: This setting defines the target Layer and data table name for the new created objects. You can select an existing Layer in the drawing or you can write the name to create a new Layer. The data of the new objects will be those of the objects selected in Group 1. Whenever possible (depending on the type of Overlay operation), data from Group 2 will be merged in the same table. For example, if Buildings and Parcels are Overlapped by Intersection, the new objects will be geometrically equal to the buildings that are located entirely or partially within any parcel, and the data table will include the data of the buildings and parcels in a combined table
- Operation
Dissolve
The command 'SPMDISSOLVE' in Spatial Manager™ for AutoCAD allows you to generate new Polygons based on the grouping of other adjacent polygons with some common data
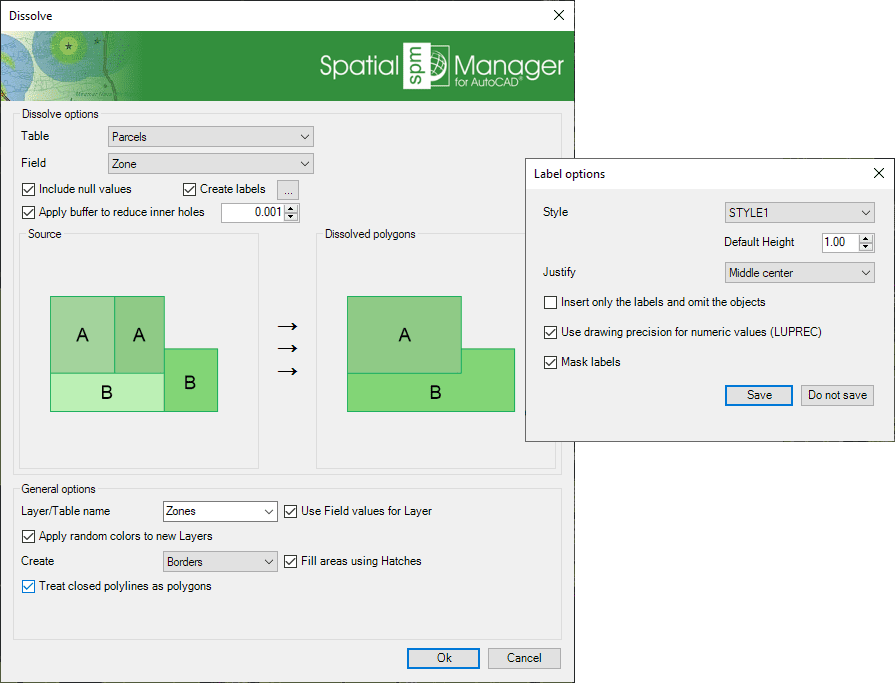
- Dissolve options: You can select the common Table/Field data for dissolving the polygons (even including null data). To reduce possible precision errors in the geometry, you can check the option to generate a temporary small buffer around the polygon boundaries in order to avoid as much as possible the generation of inner holes during the operation. Check the option "Create labels" if you want to Label the common data for every new polygon
- Label options. You can define the Style, Height and Justification of the Label Text objects here. You can configure if you want to insert the new Polygons geometry and its Labels or the Labels only. Be careful: if you check this box you will only get the Labels (Text objects) but not the dissolved polygons. As added parameters, you can set the option to use or not LUPREC for decimal places (see Notes below) and Mask labels which will generate masks (Wipeout objects, grouped with the Labels) and they will "trim" the objects located behind the Labels in order to improve its reading
- Notes:
- You can choose that the value of the LUPREC variable (Length precision) be used or not for the number of decimal places when labeling objects using a numerical field (Please, take a look to LUPREC and UNITS in the AutoCAD Help)
- Label Masks may have some functional issues or may not be available in versions earlier than AutoCAD 2017
- Notes:
- Label options. You can define the Style, Height and Justification of the Label Text objects here. You can configure if you want to insert the new Polygons geometry and its Labels or the Labels only. Be careful: if you check this box you will only get the Labels (Text objects) but not the dissolved polygons. As added parameters, you can set the option to use or not LUPREC for decimal places (see Notes below) and Mask labels which will generate masks (Wipeout objects, grouped with the Labels) and they will "trim" the objects located behind the Labels in order to improve its reading
- Table/Layer name: This setting defines the target Layer and data table name for the new dissolved Polygons. You can select an existing Layer in the drawing or you can write the name to create a new Layer. Dissolved polygons will include the common dissolve data (1 field) as the polygons to dissolve
- As you can see in the next setting, the Layer name can be variable for each new polygon but the Table name for the attached data will be unique for all the created polygons
- Use Field values for Layer: Here you can select that the Field used to merge define its value as the name of the Layer for the new polygons. If this value is null for any polygon, or the setting is left blank, the polygon will be drawn in the Layer selected in the previous setting
- Note that this setting is only for the name of the target Layer but not for the Table name
- Apply random colors to new Layers
- Create: Dissolved objects type, Borders or Polygons. The Polygons option allow you to select MPolygons as the type of object to use. This options is available on all compatible Autodesk products (even on vanilla, plain or basic AutoCAD) (AutoCAD 2013 and upper). The MPolygons can be defined by multiple rings, even including holes, as a single AutoCAD object
- Fill areas using Hatches
- Treat closed polylines as polygons: When checked (default value), all closed Polylines in the drawing will be considered as Polygons and not as linear objects. Most of the time the closed polylines represent polygonal elements
Note: Since this operation can only be performed on polygonal objects, the application will alert the user either if there are non-polygonal objects attached to the selected table (warning) or if there are not enough polygons to process it (cancellation)
Centroids
The command 'SPMCENTROID' in Spatial Manager™ for AutoCAD includes two functionalities. The first one allows you to generate Centroids (Point objects) for the selected polygons (The polygons data, if any, will be attached also to the Centroid objects). The second one allows you to capture the selected Centroids data in order to add it to a copy of the selected Polygons that contain them
Create centroids
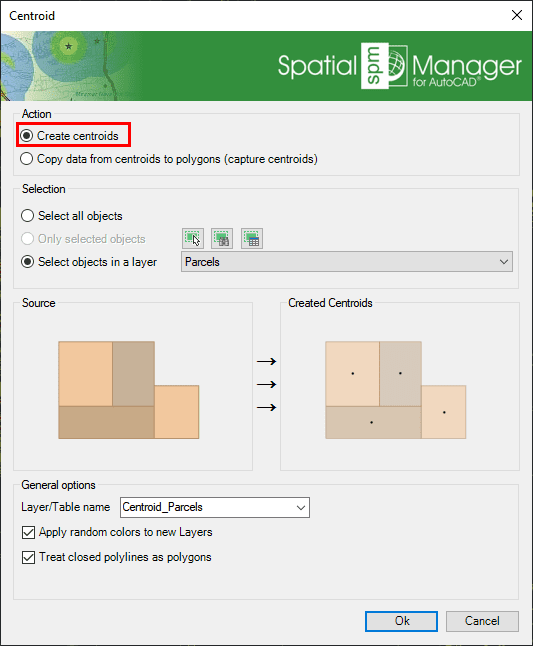
- Objects selection: See the paragraph "About objects selection" above
- Table/Layer name: This setting defines the target Layer and data table name for the Centroids. You can select an existing Layer in the drawing or you can write the name to create a new Layer. Centroids objects will adopt the same data as the corresponding polygons
- Apply random colors to new Layers
- Treat closed polylines as polygons: When checked (default value), all closed Polylines in the drawing will be considered as Polygons and not as linear objects. Most of the time the closed polylines represent polygonal elements
Copy data from centroids to polygons (capture centroids)
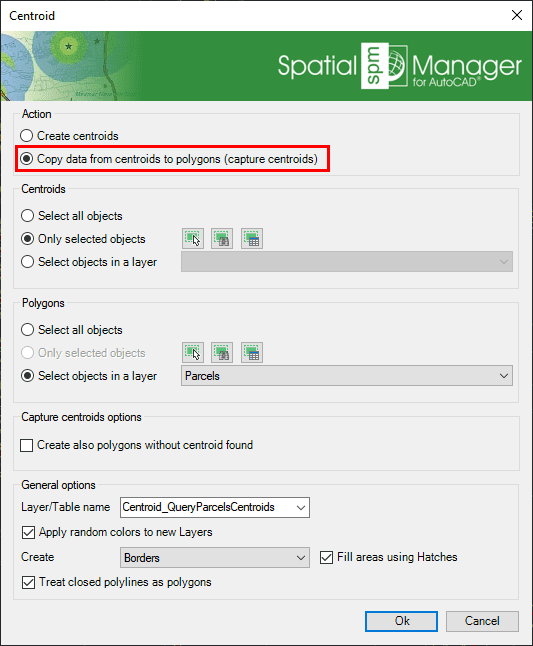
- Centroids selection: Any point object. See the paragraph "About objects selection" above
- Polygons selection: Any polygonal object. See the paragraph "About objects selection" above
- Capture centroids options
- Create also polygons without centroid found: As a copy of the selected polygons that contain any Centroid will be created, you can also choose to duplicate even polygons without Centroid found
- Table/Layer name: This setting defines the target Layer and data table name for the created polygons. You can select an existing Layer in the drawing or you can write the name to create a new Layer
- Apply random colors to new Layers
- Create: Duplicate polygons object type, Borders or Polygons. The Polygons option allow you to select MPolygons as the type of object to use. This options is available on all compatible Autodesk products (even on vanilla, plain or basic AutoCAD) (AutoCAD 2013 and upper). The MPolygons can be defined by multiple rings, even including holes, as a single AutoCAD object
- Fill areas using Hatches
- Treat closed polylines as polygons: When checked (default value), all closed Polylines in the drawing will be considered as Polygons and not as linear objects. Most of the time the closed polylines represent polygonal elements
Areas of Influence
The command 'SPMINFLUENCEAREAS' in Spatial Manager™ for AutoCAD allows you to generate Polygons defined by the set of points closest to each point of a selection of Points in the drawing (Voronoi diagram). Each Polygon generated will adopt the same data (if any) as the corresponding Point. For example, would serve to determine which nearby areas are covered by each pharmacy in a municipality, and similar scenarios
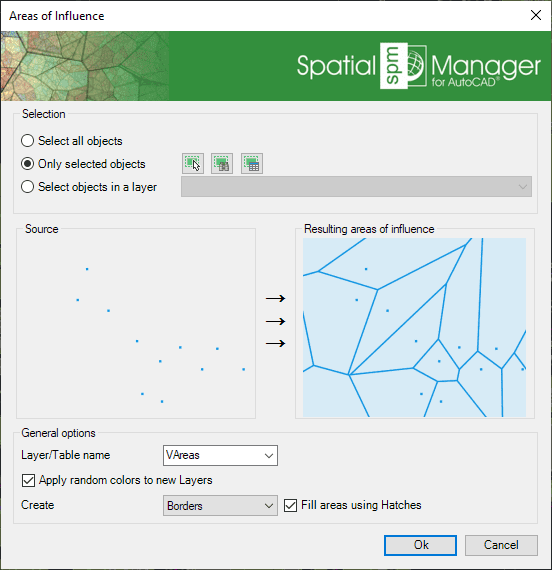
- Objects selection: See the paragraph "About objects selection" above
- Table/Layer name: This setting defines the target Layer and data table name for the new Polygons. You can select an existing Layer in the drawing or you can write the name to create a new Layer. Areas of Influence objects will adopt the same data as the corresponding Points
- Apply random colors to new Layers
- Create: Areas of Influence objects type, Borders or Polygons. The Polygons option allow you to select MPolygons as the type of object to use. This options is available on all compatible Autodesk products (even on vanilla, plain or basic AutoCAD) (AutoCAD 2013 and upper). The MPolygons can be defined by multiple rings, even including holes, as a single AutoCAD object
- Fill areas using Hatches
Related links
- Blog posts
![]()
![]()