Difference between revisions of "Spatial Manager Desktop™ - FAQs: GIS Analysis ("Professional" edition only)"
m |
m |
||
| (21 intermediate revisions by the same user not shown) | |||
| Line 11: | Line 11: | ||
===Introduction=== | ===Introduction=== | ||
*'''Objective of this section''' | *'''Objective of this section''' | ||
| − | **To learn how to use advanced GIS analysis tools in your | + | **To learn how to use advanced GIS analysis tools in your maps |
*'''Topics in this section''' | *'''Topics in this section''' | ||
| − | **Create Buffers from point, linear or polygonal borders | + | **Create Buffers from point, linear or polygonal borders features |
| − | **Process spatial Overlays which will create new | + | **Process spatial Overlays which will create new map features based on the operation results |
| − | **Dissolve polyonal | + | **Dissolve polyonal features in order to create surrounds of adjacent features |
**Create Centroids from selected polygons | **Create Centroids from selected polygons | ||
| − | **Calculate and | + | **Calculate and create Areas of Influence from selected point features |
==GIS Analysis tools== | ==GIS Analysis tools== | ||
| − | Spatial | + | Spatial Manager Desktop™ includes a set of advanced tools designed for geometric and spatial analysis of geographic features and their geometric relationships, resulting in new features generated from the resolution of such analysis |
| − | |||
| + | [[image:SPMDtopGISAnalysis.png|border|900px|Performing GIS Analysis in the map|link={{filepath:SPMDtopGISAnalysis.png}}]] | ||
| − | |||
| + | ''Performing GIS Analysis in the map'' | ||
| − | |||
| + | '''About features selection''' | ||
| − | + | Some of the analysis tools described below allow you to select features before executing. Even some of them (SPMOVERLAY) allow you to select two groups of features to operate between them. For all of these functions, the following notes and instructions apply: | |
| − | + | *''Selected objects'': Only a selection of features will be processed. You can select the features before executing the functions by using [[Spatial_Manager_Desktop%E2%84%A2_-_FAQs:_Selecting_and_filtering#How_can_I_select_Features_of_a_Map.3F|''any of the application Selection methods'']] | |
| − | + | *''Layer'': Only the features included in a map Layer will be processed. You can select the layer using the drop-down list in this window | |
| − | |||
| − | |||
| − | Some of the analysis tools described below allow | ||
| − | *'' | ||
| − | |||
| − | |||
| − | |||
| − | |||
| − | |||
| − | *'' | ||
| − | |||
===Buffer=== | ===Buffer=== | ||
| − | The | + | The Buffer function in Spatial Manager Desktop™ allows you to generate in a new layer Buffered polygons around point features, linear features or polygon boundaries. Buffer distance can be constant or taken from the value of a table field for each feature, it is possible to merge the generated features in their common areas and different styles of joins and endings can be chosen |
| − | <span title="Buffer parameters window">[[image: | + | <span title="Buffer parameters window">[[image:SPMDtopBuffer.png|link=]]</span> |
| − | *'' | + | *''Selection: See the paragraph [[#GIS_Analysis_tools|''"About features selection"'']] above |
*''Buffer options:'' You can select the Buffer distance (fixed value or field-based value), the distance units (read below), the Join and End cap styles and if you want to Dissolve/Merge the generated Buffered polygons | *''Buffer options:'' You can select the Buffer distance (fixed value or field-based value), the distance units (read below), the Join and End cap styles and if you want to Dissolve/Merge the generated Buffered polygons | ||
| − | **About Units conversion: If a coordinate system with a defined unit of measurement is assigned to the | + | **About Units conversion: If a coordinate system with a defined unit of measurement is assigned to the map, the user can select another unit from the drop-down list to define the Buffer distance entered and the application will perform the conversion between it and the one defined by the coordinate system. If the map does not have a coordinate system assigned to it, or the coordinate system does not have defined units, the user can select from the drop-down lists the unit in which the entered Buffer distance is defined and the map units; the application will perform the conversion between the two |
| − | |||
| − | |||
| − | |||
| − | |||
| − | |||
===Overlay=== | ===Overlay=== | ||
| − | The | + | The Overlay function in Spatial Manager Desktop™ allows you to create new features based on geometric and data operations between two existing feature groups |
| − | <span title="Overlay parameters window">[[image: | + | <span title="Overlay parameters window">[[image:SPMDtopOverlay.png|link=]]</span> |
| − | This function allows you to generate new | + | This function allows you to generate new features in a new layer of the map by performing "geometric operations" between two groups of existing features: "Selection" (Group 1) and "Overlay" (Group 2). For example, according to the chosen parameters in this image, for all selected features (Roads, etc.) that are located within any Parcel, the Overlay Identity function will create new features which will are equal to the Selection features "broken" in the Parcel limits |
| − | *'' | + | *''Selection: See the paragraph [[#GIS_Analysis_tools|''"About features selection"'']] above (Group 1 and Group 2) |
*Overlay parameters and options | *Overlay parameters and options | ||
**Operation | **Operation | ||
| − | ***''Intersect'': Determines the geometries that overlap in the | + | ***''Intersect'': Determines the geometries that overlap in the Selection and Overlay feature groups. Anything that does not overlap is discarded from the output, so the resulting features represent what the Selection and Overlay have in common. Use Intersect in order to find points or lines that lie within a polygon, or to determine the places where two linear features overlap. For example, find tree point features that are within park polygons. The resulting data table will include the data of both the Selection and Overlay features |
| − | ***''Union'': Determines the geometries that exist in either the | + | ***''Union'': Determines the geometries that exist in either the Selection and Overlay features. Where the geometries intersect, additional features are created. The resulting features are the sum of the two comparison feature groups. Use Union in order to combine two group of related polygons. For example, create new features that combine the business district and the theater district when the features overlap. The resulting data table will include the data of both the Selection and Overlay features |
| − | ***''Erase'': Determines the geometries from the | + | ***''Erase'': Determines the geometries from the Selection features that do not intersect with the Overlay features. Use Erase in order to subtract sections for a group of features. For example, find all roads that lie outside the enterprise district, or all hospitals that are outside a flod zone. The resulting data table will include the data of Selection features only |
| − | ***''Identity'': Creates new | + | ***''Identity'': Creates new features where the Selection and Overlay features intersect. Use Identity in order to split features at the point where they intersect with another features group, and to create new features at that point. For example, divide roads or parcels where they cross city borders. The resulting data table will include the data of both the Selection and Overlay features |
| − | ***''Clip'': Like Intersect, Clip creates | + | ***''Clip'': Like Intersect, Clip creates features from the areas of the Selection that overlap with the Overlay. Use Clip in order to find features that lie within a geometric area. For example, find hydrants within a development, or road segments within a particular neighborhood. The resulting data table will include the data of Selection features only |
| − | ***''Paste'': Creates new | + | ***''Paste'': Creates new features by pasting the Overlay features onto the Selection features. All Overlay features become new features in the operation result. In addition, the areas of the Selection that do not fall within the Overlay features become also new features in the operation result. Use Paste in order to combine two overlaping groups of features. For example, add the data of city districts to the developments that overlap. The resulting data table will include the data of both the Selection and Overlay features |
| − | ***''Symmetric Difference'': Determines the areas in the | + | ***''Symmetric Difference'': Determines the areas in the Selection and Overlay that do not overlap. Overlapping areas of the features are discarded in the output. The non-overlapping areas become new features. Use Symmetric Difference in order to find areas that are mutually exclusive in two group of features. For example, find new housing developments that are outside school districts. The resulting data table will include the data of both the Selection and Overlay features |
| − | |||
| − | |||
| − | |||
| − | |||
| − | |||
| − | |||
===Dissolve=== | ===Dissolve=== | ||
| − | The | + | The Dissolve function in Spatial Manager Desktop™ allows you to generate new Polygons based on the grouping of other adjacent polygons with some common data |
| + | |||
| + | <span title="Dissolve parameters window">[[image:SPMDtopDissolve.png|link=]]</span> | ||
| − | |||
| + | You can select the common Table/Field data for dissolving the polygons (even including null data). To reduce possible precision errors in the geometry, you can check the option to generate a temporary small buffer around the polygon boundaries in order to avoid as much as possible the generation of inner holes during the operation | ||
| − | |||
| − | |||
| − | |||
| − | |||
| − | |||
| − | |||
| − | |||
| − | |||
| − | |||
| − | |||
| − | ''Note: Since this operation can only be performed on polygonal | + | ''Note: Since this operation can only be performed on polygonal features, the application will alert the user either if there are non-polygonal features in the selected table (warning) or if there are not enough polygons to process it (cancellation)'' |
===Centroids=== | ===Centroids=== | ||
| − | The | + | The Centroids function in Spatial Manager Desktop™ allows you to generate in a new map layer the Centroids (Point features) for the selected polygons. The polygons data (if any) will be attached also to the Centroid features |
| − | <span title="Centroid parameters window">[[image: | + | <span title="Centroid parameters window">[[image:SPMDtopCentroid.png|link=]]</span> |
| − | *'' | + | *''Selection: See the paragraph [[#GIS_Analysis_tools|''"About features selection"'']] above |
| − | |||
| − | |||
| − | |||
===Areas of Influence=== | ===Areas of Influence=== | ||
| − | The | + | The Areas of Influence function in Spatial Manager Desktop™ allows you to generate in a new map layer Polygons defined by the set of points closest to each point of a selection of Points in the map ([https://en.wikipedia.org/wiki/Voronoi_diagram ''Voronoi diagram'']). Each Polygon generated will adopt the same data (if any) as the corresponding Point. For example, would serve to determine which nearby areas are covered by each pharmacy in a municipality, and similar scenarios |
| − | <span title="Areas of Influence parameters window">[[image: | + | <span title="Areas of Influence parameters window">[[image:SPMDtopAreasInfluence.png|link=]]</span> |
| − | *'' | + | *''Selection: See the paragraph [[#GIS_Analysis_tools|''"About features selection"'']] above |
| − | |||
| − | |||
| − | |||
| − | |||
Revision as of 21:23, 6 July 2021
![]()
![]()
Notes:
- Some components in the images on this page (providers, names, windows look, etc.) may be slightly different from those that will appear on your computer
- Some application functions need to access the Internet from the application itself. If you experiment problems in any process, ask your network administrator if there is a Proxy server installed on your network. You can configure the Proxy settings through the application options
Introduction
- Objective of this section
- To learn how to use advanced GIS analysis tools in your maps
- Topics in this section
- Create Buffers from point, linear or polygonal borders features
- Process spatial Overlays which will create new map features based on the operation results
- Dissolve polyonal features in order to create surrounds of adjacent features
- Create Centroids from selected polygons
- Calculate and create Areas of Influence from selected point features
GIS Analysis tools
Spatial Manager Desktop™ includes a set of advanced tools designed for geometric and spatial analysis of geographic features and their geometric relationships, resulting in new features generated from the resolution of such analysis
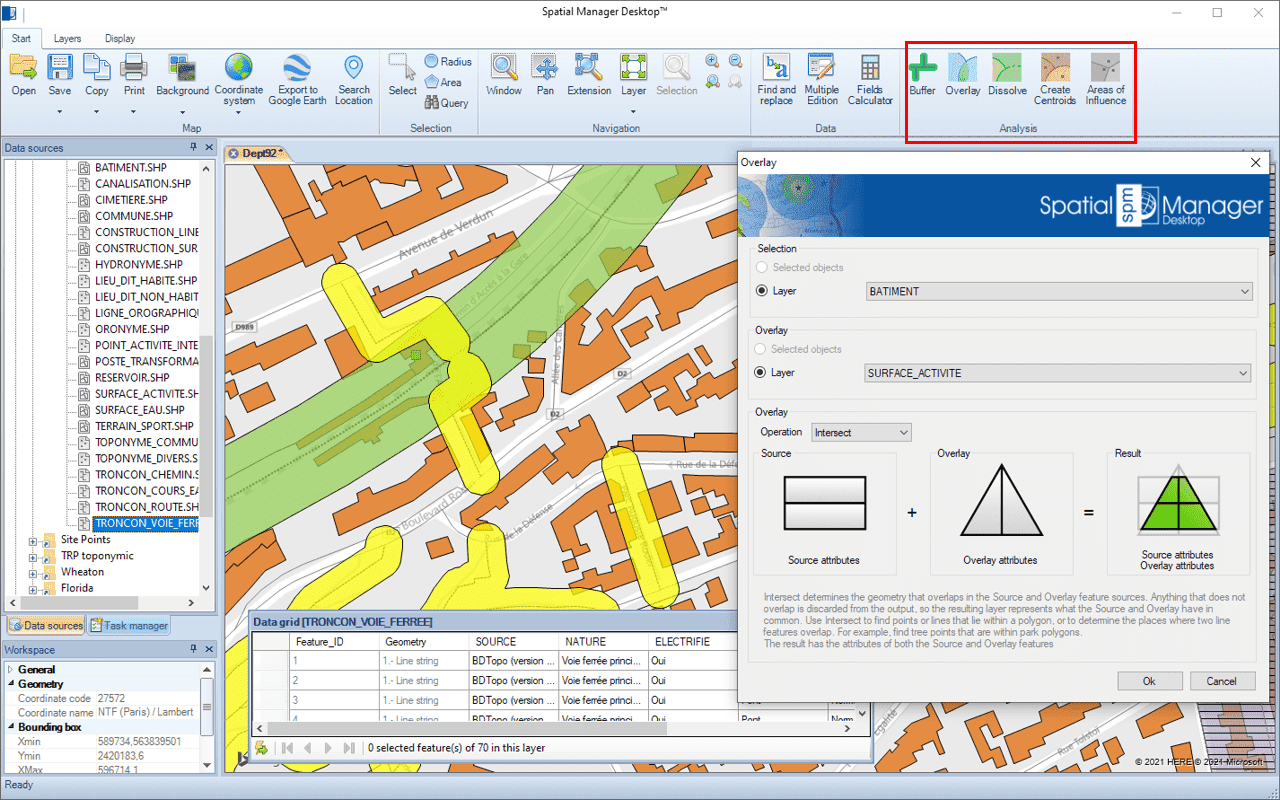
Performing GIS Analysis in the map
About features selection
Some of the analysis tools described below allow you to select features before executing. Even some of them (SPMOVERLAY) allow you to select two groups of features to operate between them. For all of these functions, the following notes and instructions apply:
- Selected objects: Only a selection of features will be processed. You can select the features before executing the functions by using any of the application Selection methods
- Layer: Only the features included in a map Layer will be processed. You can select the layer using the drop-down list in this window
Buffer
The Buffer function in Spatial Manager Desktop™ allows you to generate in a new layer Buffered polygons around point features, linear features or polygon boundaries. Buffer distance can be constant or taken from the value of a table field for each feature, it is possible to merge the generated features in their common areas and different styles of joins and endings can be chosen
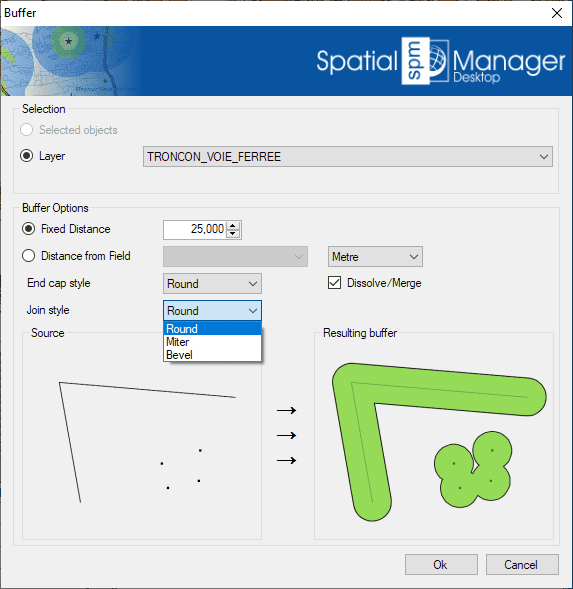
- Selection: See the paragraph "About features selection" above
- Buffer options: You can select the Buffer distance (fixed value or field-based value), the distance units (read below), the Join and End cap styles and if you want to Dissolve/Merge the generated Buffered polygons
- About Units conversion: If a coordinate system with a defined unit of measurement is assigned to the map, the user can select another unit from the drop-down list to define the Buffer distance entered and the application will perform the conversion between it and the one defined by the coordinate system. If the map does not have a coordinate system assigned to it, or the coordinate system does not have defined units, the user can select from the drop-down lists the unit in which the entered Buffer distance is defined and the map units; the application will perform the conversion between the two
Overlay
The Overlay function in Spatial Manager Desktop™ allows you to create new features based on geometric and data operations between two existing feature groups
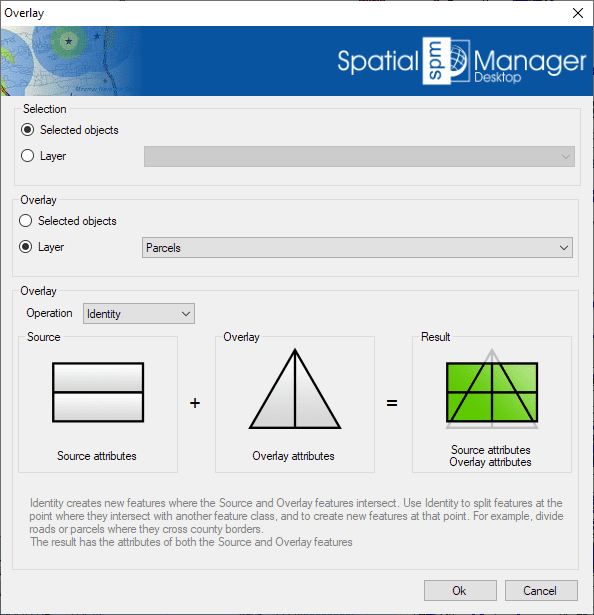
This function allows you to generate new features in a new layer of the map by performing "geometric operations" between two groups of existing features: "Selection" (Group 1) and "Overlay" (Group 2). For example, according to the chosen parameters in this image, for all selected features (Roads, etc.) that are located within any Parcel, the Overlay Identity function will create new features which will are equal to the Selection features "broken" in the Parcel limits
- Selection: See the paragraph "About features selection" above (Group 1 and Group 2)
- Overlay parameters and options
- Operation
- Intersect: Determines the geometries that overlap in the Selection and Overlay feature groups. Anything that does not overlap is discarded from the output, so the resulting features represent what the Selection and Overlay have in common. Use Intersect in order to find points or lines that lie within a polygon, or to determine the places where two linear features overlap. For example, find tree point features that are within park polygons. The resulting data table will include the data of both the Selection and Overlay features
- Union: Determines the geometries that exist in either the Selection and Overlay features. Where the geometries intersect, additional features are created. The resulting features are the sum of the two comparison feature groups. Use Union in order to combine two group of related polygons. For example, create new features that combine the business district and the theater district when the features overlap. The resulting data table will include the data of both the Selection and Overlay features
- Erase: Determines the geometries from the Selection features that do not intersect with the Overlay features. Use Erase in order to subtract sections for a group of features. For example, find all roads that lie outside the enterprise district, or all hospitals that are outside a flod zone. The resulting data table will include the data of Selection features only
- Identity: Creates new features where the Selection and Overlay features intersect. Use Identity in order to split features at the point where they intersect with another features group, and to create new features at that point. For example, divide roads or parcels where they cross city borders. The resulting data table will include the data of both the Selection and Overlay features
- Clip: Like Intersect, Clip creates features from the areas of the Selection that overlap with the Overlay. Use Clip in order to find features that lie within a geometric area. For example, find hydrants within a development, or road segments within a particular neighborhood. The resulting data table will include the data of Selection features only
- Paste: Creates new features by pasting the Overlay features onto the Selection features. All Overlay features become new features in the operation result. In addition, the areas of the Selection that do not fall within the Overlay features become also new features in the operation result. Use Paste in order to combine two overlaping groups of features. For example, add the data of city districts to the developments that overlap. The resulting data table will include the data of both the Selection and Overlay features
- Symmetric Difference: Determines the areas in the Selection and Overlay that do not overlap. Overlapping areas of the features are discarded in the output. The non-overlapping areas become new features. Use Symmetric Difference in order to find areas that are mutually exclusive in two group of features. For example, find new housing developments that are outside school districts. The resulting data table will include the data of both the Selection and Overlay features
- Operation
Dissolve
The Dissolve function in Spatial Manager Desktop™ allows you to generate new Polygons based on the grouping of other adjacent polygons with some common data
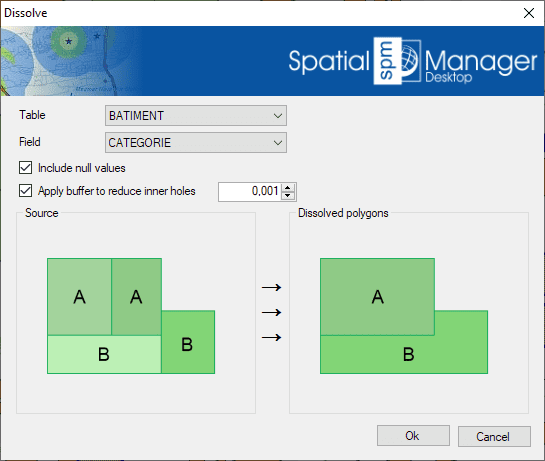
You can select the common Table/Field data for dissolving the polygons (even including null data). To reduce possible precision errors in the geometry, you can check the option to generate a temporary small buffer around the polygon boundaries in order to avoid as much as possible the generation of inner holes during the operation
Note: Since this operation can only be performed on polygonal features, the application will alert the user either if there are non-polygonal features in the selected table (warning) or if there are not enough polygons to process it (cancellation)
Centroids
The Centroids function in Spatial Manager Desktop™ allows you to generate in a new map layer the Centroids (Point features) for the selected polygons. The polygons data (if any) will be attached also to the Centroid features
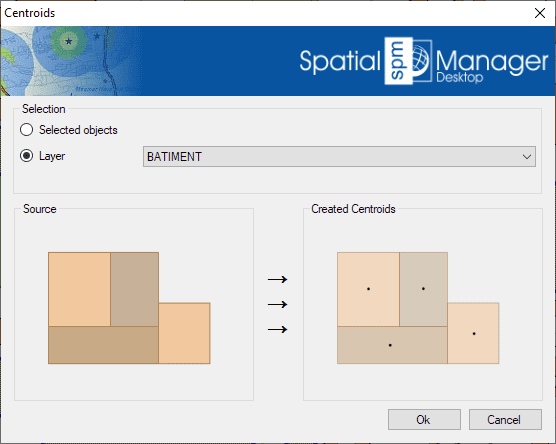
- Selection: See the paragraph "About features selection" above
Areas of Influence
The Areas of Influence function in Spatial Manager Desktop™ allows you to generate in a new map layer Polygons defined by the set of points closest to each point of a selection of Points in the map (Voronoi diagram). Each Polygon generated will adopt the same data (if any) as the corresponding Point. For example, would serve to determine which nearby areas are covered by each pharmacy in a municipality, and similar scenarios
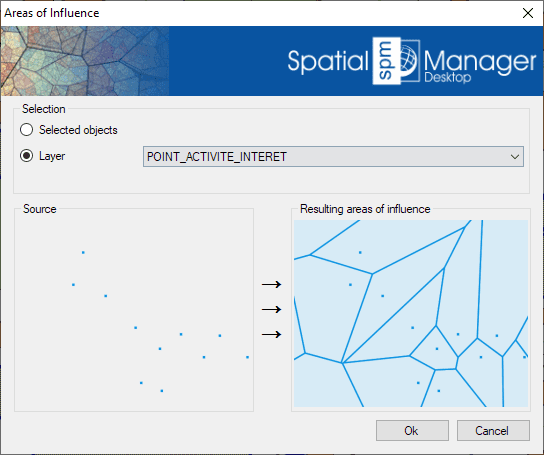
- Selection: See the paragraph "About features selection" above
Related links
![]()
![]()